National Sex Offender Map: Visualizing Offender Concentration Across the U.S.
A national sex offender map offers a high-level visual snapshot of where registered sex offenders are concentrated across the United States. Locations are based on last reported registry addresses aggregated from state databases. Instead of listing individual records, this type of map highlights geographic patterns and regional distribution, making it easier to understand how concentration varies from state to state and between urban and rural areas.
Public registry information is collected under Megan's Law and standardized through federal guidelines, but it is reported and maintained by individual states. Nationwide access is coordinated through the U.S. Department of Justice and the National Sex Offender Public Website. KidsLiveSafe uses this public data to generate a static, national-level visualization of offender concentration. This page explains what the map shows, how to interpret it responsibly, and the legal limits of mapped registry data.
Data verified and updated January 2026 • Source: U.S. Department of Justice, NSOPW.gov, and state registry databases aggregated by KidsLiveSafe.
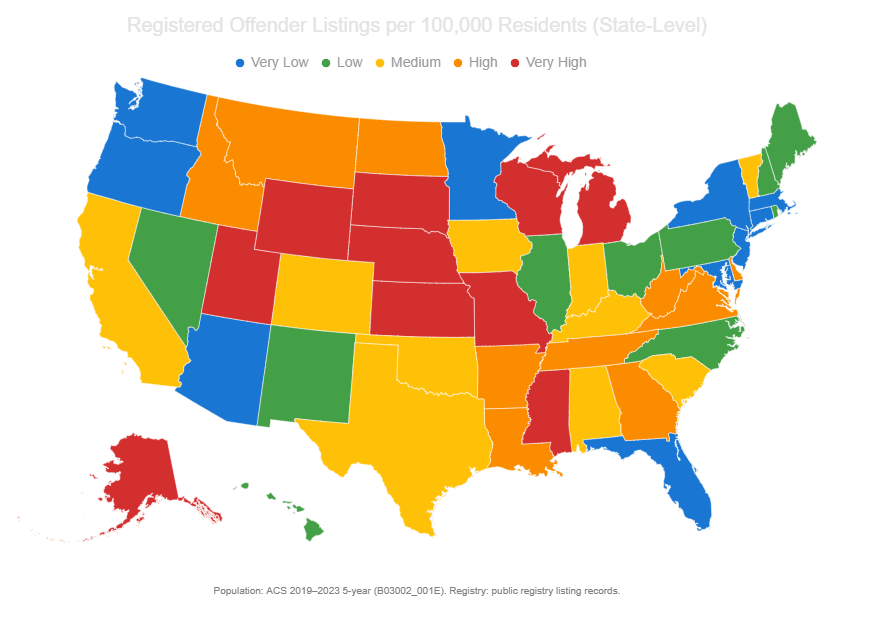
U.S. Sex Offender Concentration Map
Registered Offenders per 100,000 Residents (State-Level)
State-Level Offender Distribution
| State | Registered Offenders | Population | Per 100k Residents | Category |
|---|---|---|---|---|
| Alabama | 20,632 | 5,108,468 | 403.9 | Very High |
| Alaska | 8,866 | 733,391 | 1,208.9 | Very High |
| Arizona | 17,537 | 7,497,000 | 233.9 | Very Low |
| Arkansas | 16,741 | 3,067,732 | 545.8 | Very High |
| California | 105,683 | 38,965,193 | 271.2 | Very Low |
| Colorado | 19,719 | 5,877,610 | 335.5 | Medium |
| Connecticut | 12,107 | 3,612,314 | 335.3 | Medium |
| Delaware | 3,516 | 1,031,890 | 340.8 | Medium |
| Florida | 56,937 | 22,610,726 | 251.8 | Very Low |
| Georgia | 33,327 | 11,029,227 | 302.1 | Low |
| Hawaii | 2,217 | 1,440,196 | 153.9 | Very Low |
| Idaho | 8,720 | 1,964,726 | 443.9 | High |
| Illinois | 26,783 | 12,549,689 | 213.4 | Very Low |
| Indiana | 20,578 | 6,862,199 | 299.9 | Low |
| Iowa | 9,350 | 3,207,004 | 291.5 | Low |
| Kansas | 13,188 | 2,954,832 | 446.5 | High |
| Kentucky | 19,163 | 4,565,882 | 419.8 | High |
| Louisiana | 23,224 | 4,590,241 | 506.1 | Very High |
| Maine | 4,314 | 1,395,722 | 309.1 | Low |
| Maryland | 14,705 | 6,180,253 | 237.9 | Very Low |
| Massachusetts | 13,042 | 6,981,974 | 186.8 | Very Low |
| Michigan | 43,394 | 10,037,261 | 432.3 | High |
| Minnesota | 14,356 | 5,737,915 | 250.3 | Very Low |
| Mississippi | 15,919 | 2,939,690 | 541.6 | Very High |
| Missouri | 24,713 | 6,215,144 | 397.6 | High |
| Montana | 6,204 | 1,132,812 | 547.6 | Very High |
| Nebraska | 8,554 | 1,988,536 | 430.1 | High |
| Nevada | 7,586 | 3,238,601 | 234.3 | Very Low |
| New Hampshire | 3,809 | 1,402,054 | 271.7 | Very Low |
| New Jersey | 14,609 | 9,288,994 | 157.3 | Very Low |
| New Mexico | 8,230 | 2,117,522 | 388.6 | High |
| New York | 25,978 | 19,677,151 | 132.0 | Very Low |
| North Carolina | 32,963 | 10,835,491 | 304.3 | Low |
| North Dakota | 4,038 | 783,926 | 515.2 | Very High |
| Ohio | 31,460 | 11,785,935 | 266.8 | Very Low |
| Oklahoma | 18,607 | 4,053,824 | 459.1 | High |
| Oregon | 11,432 | 4,233,358 | 270.0 | Very Low |
| Pennsylvania | 30,983 | 12,972,008 | 238.8 | Very Low |
| Rhode Island | 2,787 | 1,095,962 | 254.3 | Very Low |
| South Carolina | 19,344 | 5,373,555 | 360.0 | Medium |
| South Dakota | 4,154 | 919,318 | 451.8 | High |
| Tennessee | 26,907 | 7,087,540 | 379.5 | Medium |
| Texas | 65,116 | 30,503,301 | 213.5 | Very Low |
| Utah | 6,338 | 3,417,734 | 185.4 | Very Low |
| Vermont | 1,813 | 647,464 | 280.0 | Low |
| Virginia | 19,894 | 8,715,698 | 228.3 | Very Low |
| Washington | 12,294 | 7,958,186 | 154.5 | Very Low |
| West Virginia | 9,726 | 1,768,503 | 549.9 | Very High |
| Wisconsin | 26,168 | 5,893,718 | 444.1 | High |
| Wyoming | 3,247 | 584,057 | 556.0 | Very High |
Note: State-level data table to be populated with current registry statistics.
What a Sex Offender Map Shows (and What It Doesn't)
A sex offender map displays the last reported public registry locations of individuals who are legally required to register with law enforcement. These locations are plotted geographically to show regional distribution and relative concentration, rather than to track individual movement. When viewed at a national or state level, the map highlights broad patterns, such as higher concentrations in densely populated urban areas and lighter distribution in rural areas.
In short, the map visualizes location and concentration—not real-time behavior.
A sex offender map shows you:
- General geographic clustering
- State and regional distribution patterns
- Relative density by area
It's also important to note what a sex offender map does not show. It does not display real-time locations, daily movement, or unreported individuals. It also does not reflect current risk in a neighborhood on its own, since offense type, time since conviction, and compliance status all vary.
Understanding both the capabilities and limits of a sex offender map is essential for interpreting the data responsibly and accurately.
See What Shows Up on Your Local Map
Get notified when relevant registry information changes in your area.
Start Your Search NowHow to Interpret Offender Concentration on a Map
When viewing offender concentration on a map, it's important to understand what visible clustering actually represents. Clustering reflects geographic and population factors—not individual behavior.
Darker or denser areas typically reflect population size and housing density, and don't automatically signal higher levels of risk. Large metropolitan regions often appear more concentrated simply because more people— and therefore more homes— are located within a smaller geographic footprint.
By contrast, rural regions might appear lighter on a national map because homes and communities are spread across wider areas, even if the per-capita rate is similar. Zoning laws, parole or transitional housing availability, and state reporting practices can also impact where registrants live and how concentration appears visually.
For meaningful interpretation, map-based concentration should always be considered alongside:
- Offense type
- Time since conviction
- Proximity to key locations such as schools and parks
Viewing concentration this way helps prevent misinterpretation and supports more informed, balanced safety awareness.
Legal Limits of Sex Offender Map Data
Sex offender maps are designed to support public awareness and lawful safety planning— not to provide real-time tracking or complete surveillance of an individual's movements. The information displayed on a map is limited to what individuals are legally required to report and what states are permitted to release under Megan's Law and related statutes. This typically includes identity details, offense category, and a last verified address.
Not every offender appears on public maps. Juvenile cases are generally excluded, and some individuals may be removed from registries after completing their legal obligations. In addition, update timelines vary by state, meaning map data may not reflect address changes immediately.
Registry and map data is intended strictly for lawful public safety awareness and may not be used for harassment, intimidation, discrimination, or vigilantism.
FAQs about Sex Offender Maps
Is there a national sex offender map?
Yes. National-level maps aggregate public registry data from individual state registries to display registered offender locations across the United States in a single visual format. These maps reflect the last reported address of a registered individual, not their real-time movement.
How accurate are sex offender maps?
Maps are only as accurate as the most recent information reported to law enforcement. Update frequency varies by state, and address changes may not appear immediately after they're submitted.
Why do some states appear darker than others?
Darker regions usually reflect higher population density, housing concentration, and zoning patterns— they don't automatically indicate a higher risk. Urban areas often appear more concentrated than rural areas for this reason.
Does a sex offender map show real-time locations?
No, sex offender maps don't provide real-time tracking. They only display the last verified address reported to the registry and do not monitor daily movement or activity.
How KidsLiveSafe Uses Map Data for Ongoing Awareness
A static national map offers a helpful big-picture view of offender concentration, but local safety awareness works best when it goes beyond a single snapshot in time. KidsLiveSafe builds on publicly available registry data by combining mapped visualization with tools designed to support ongoing awareness at the neighborhood level.
In addition to map-based views, KidsLiveSafe includes features such as address monitoring and neighborhood alerts that notify users when changes occur near locations they care about, such as their home, children's school, or workplace. This allows families to stay aware of updates without needing to repeat manual searches across multiple state or federal databases.
Finally, KidsLiveSafe reports utilize information from 350 million public records, going beyond sex offender records to provide greater context about the people who live and work near your family. It's one more way families can stay informed without having to piece everything together on their own.
Data Sources and Verification
All information provided through KidsLiveSafe originates from official, publicly accessible records managed by government agencies.
KidsLiveSafe aggregates and standardizes data from:
- • The U.S. Department of Justice's National Sex Offender Public Website (NSOPW).
- • Adam Walsh Child Protection and Safety Act
- • History of Federal Sex Offender Registration and Notification
- • Sex Offender Registration And Notification Act (SORNA)
- • Individual state (CA), (NY), (TX), territorial, and tribal registries reporting under Megan's Law (SMART).
This data is consolidated, cross-checked, and verified to reflect the most current registry entries available nationwide.
Data is updated continuously and verified monthly for accuracy (Last Update Jan 2026).
By: KidsLiveSafe Research Team
Reviewed by: Compliance Lead
Sources: NSOPW, U.S. state sex offender registries
Last updated: January 2026
Methodology: We partner with Family Watch Dog to query NSOPW and state registries; data refresh frequency follows jurisdiction schedules.